Insurance Producer KPIs: Elite Growth Framework 2026
- 2 days ago
- 12 min read
Total premium is a vanity metric that tells you where your agency was six months ago, not where it's going tomorrow. If you're still judging performance by the size of a book, you're driving your agency looking through the rearview mirror. It's a dangerous way to manage a high-stakes business. Identifying the right key performance indicators for insurance producers is the difference between a scaling powerhouse and an agency stuck in a cycle of high turnover and stagnant growth. You know the frustration of watching a new hire struggle for two years only to realize they never had the behavioral velocity to succeed. It's an expensive mistake you can't afford to repeat.
We're going to fix that. This guide provides an elite growth framework designed to master the leading and lagging indicators that separate top-tier P&C producers from the industry average. You'll learn how to implement a data-driven sales culture that can reduce producer ramp-up time by 50% and double the likelihood of your team reaching elite status. We'll move beyond basic revenue targets to examine the specific activity metrics that predict future commissions with surgical precision. It's time to stop guessing and start engineering your agency's success.
Table of Contents
Beyond Premium: Why Traditional Insurance KPI Tracking Is Broken
Success in the P&C industry is often reduced to a single number: total premium. This is a fatal mistake. While premium is the ultimate goal, it's a lagging indicator that only confirms what happened months ago. Key performance indicators for insurance producers are more than just financial totals. They are the behavioral and financial metrics used to predict and verify sales effectiveness before the commission check ever arrives. Relying solely on premium is the "Lagging Indicator Trap." It forces agency owners into reactive management, where they only discover a producer is failing when it's too late to save the investment.
This reactive approach creates a "Cost of Stagnation." These are the invisible performance gaps that drain agency capital through high turnover and slow ramp-up times. If you're only looking at accounting KPIs, you aren't managing growth; you're managing history. Elite agencies have shifted their focus to growth KPIs that measure the velocity of the sales process itself. Are your producers merely busy, or are they effective? Is your agency's future secure, or are you just lucky this quarter?
The Difference Between Leading and Lagging Indicators
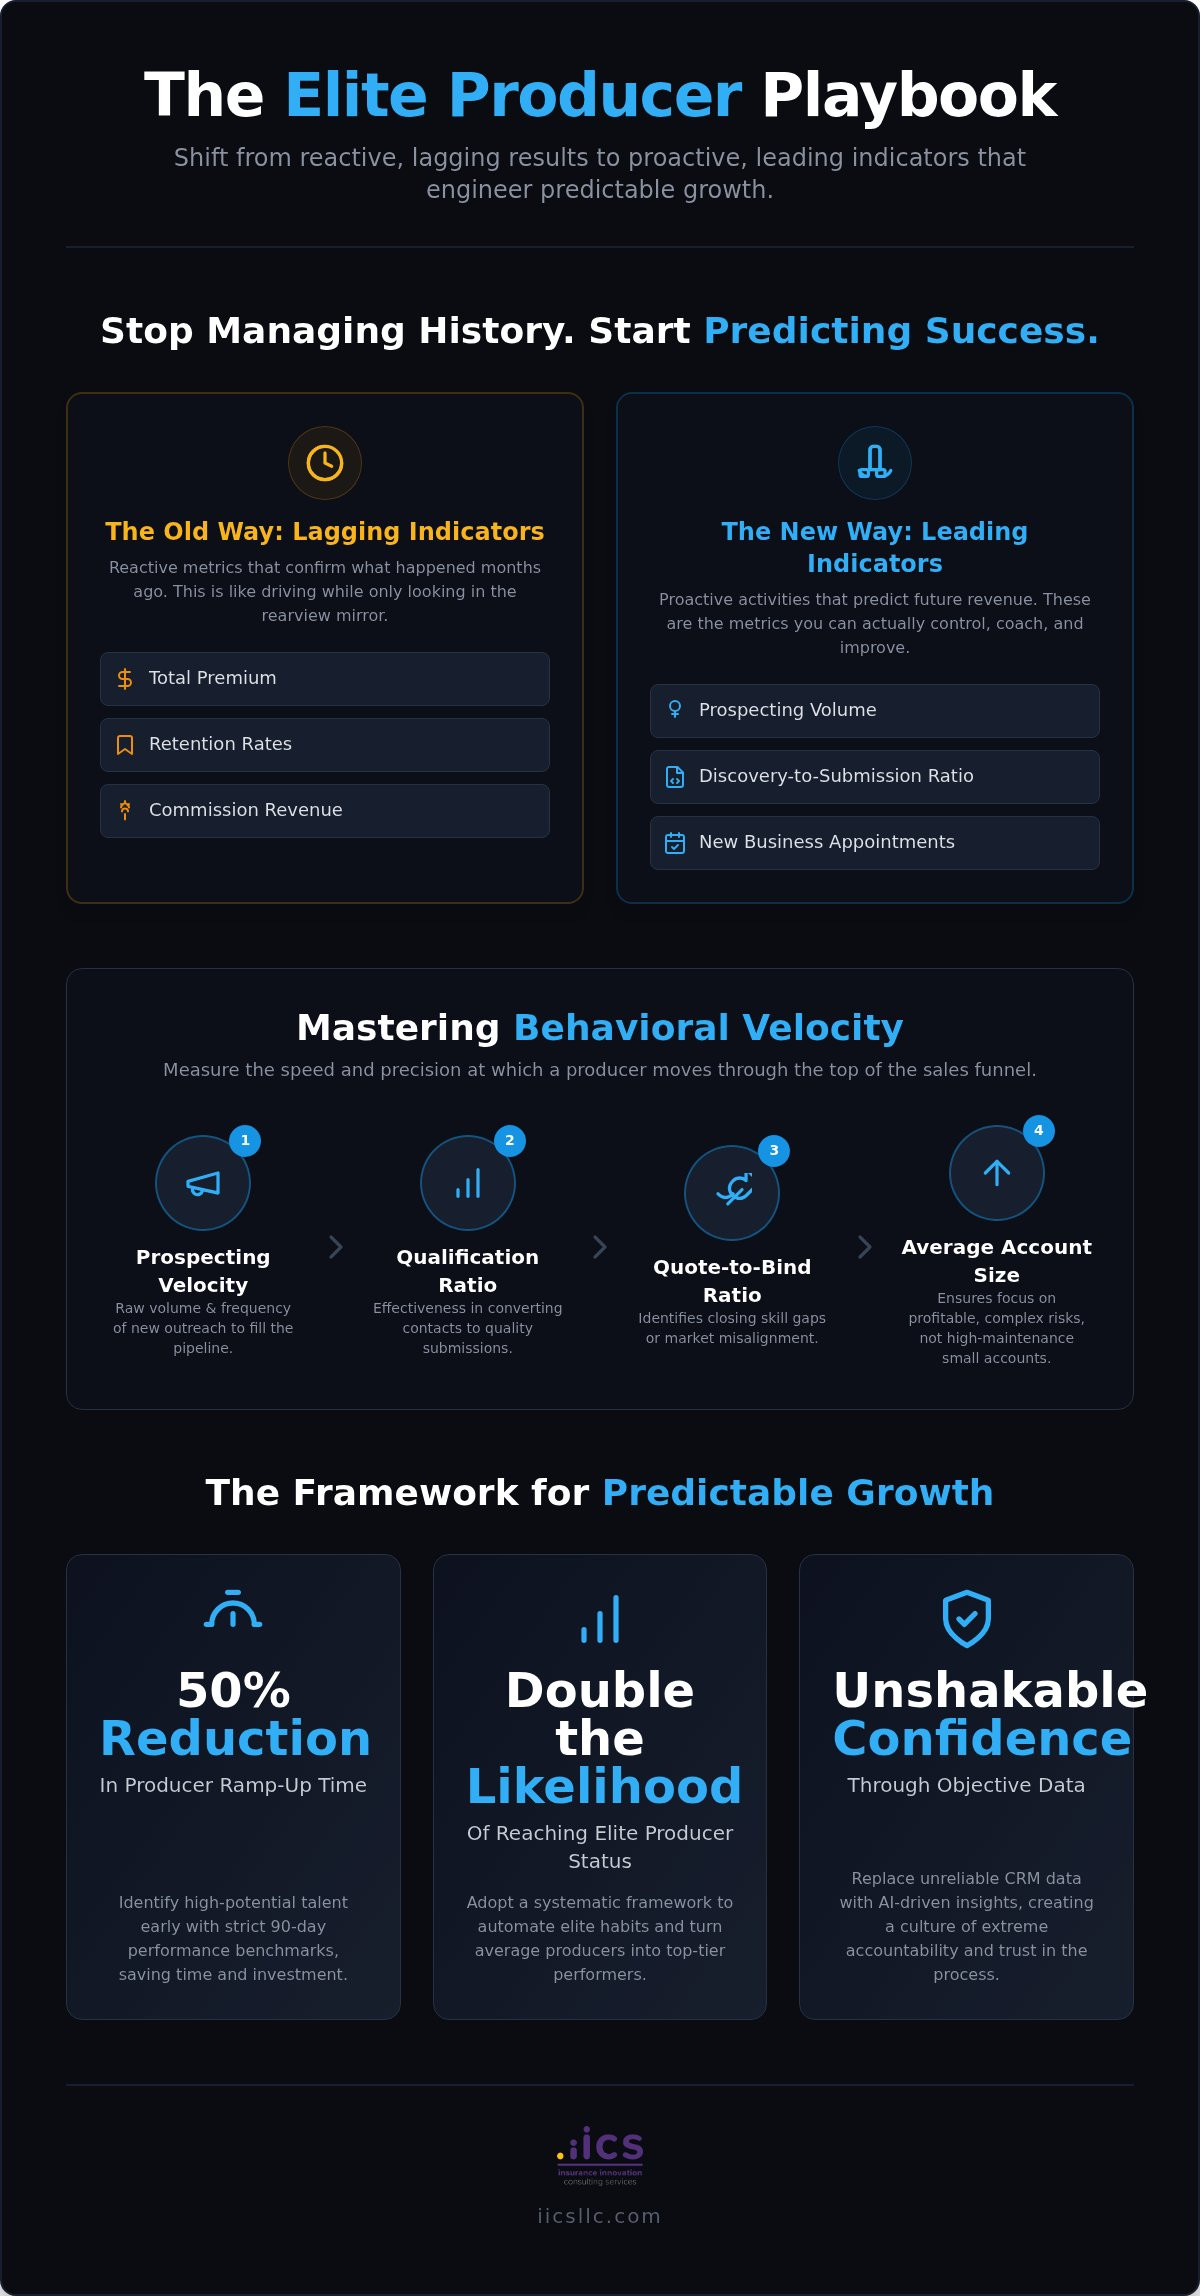
Lagging indicators like total premium, retention rates, and commission revenue are the final score of the game. They're essential for your balance sheet but useless for active coaching. Conversely, leading indicators like prospecting calls, first appointments, and submission quality provide a real-time map of future revenue. You can't coach a producer to "have more premium." You can, however, coach them to improve their discovery-to-submission ratio or increase their daily outreach volume. Leading indicators are the only metrics you can actually influence through leadership and training.
The Emotional Reality of High-Stakes Performance
Data isn't just for the back office. Elite producers use these metrics to build unshakable confidence. When a producer knows their specific math, specifically how many calls lead to a submission, they stop fearing the "no" and start trusting the process. This transparency builds a culture of extreme accountability where performance is objective, not personal. Is your agency managing by looking in the rearview mirror, or are you brave enough to look at the data that actually predicts your survival?
The Leading Indicators of High-Performance P&C Sales
Waiting for the end of the month to evaluate your team is a recipe for failure. Elite agencies focus on behavioral velocity. This is the speed and precision at which a producer moves through the top of the sales funnel. To build a predictable revenue engine, you must track the key performance indicators for insurance producers that signal future success before a single policy is bound. If the activity isn't there, the revenue won't follow. It is that simple.
Prospecting velocity is your first line of defense against a dry pipeline. This measures the raw volume and frequency of new outreach. Is the producer making enough contacts to sustain their goals? Following this, the discovery-to-submission ratio reveals how effectively they qualify those contacts. A low ratio suggests a producer is "quoting everything that breathes," wasting your account managers' time on low-probability business. Conversely, the quote-to-bind ratio identifies exactly where the sales process is breaking down. If they are quoting but not closing, they lack the closing skills or the market alignment necessary to win.
Average account size determines if your producers are hunting for elite targets or merely collecting small, high-maintenance accounts. A producer who writes fifty small accounts may hit their premium target, but they'll eventually drown in service work. Tracking this metric ensures your team is moving up-market toward more profitable, complex risks.
Activity Metrics: The Engine of Growth
Non-negotiable standards are the hallmark of a high-performance culture. Every producer should have a weekly quota for new business appointments. This is the ultimate leading indicator. We also track "disqualified prospects" as a badge of honor. An elite producer knows their time is an investment; they shouldn't spend it on prospects that don't fit the agency's ideal profile. Finally, we monitor the call-to-meeting conversion rate. This is the first indicator of true sales mastery. If they can't get the meeting, they can't make the sale.
Submission and Underwriting Metrics
Submission quality is often overlooked but it's critical for agency efficiency. When a producer aligns their prospects with carrier appetite, bind ratios skyrocket. If you want to see an immediate impact on your bottom line, implement advanced commercial insurance sales techniques that focus on submission precision. We also track time-to-quote to identify internal friction. If your internal processes are slow, you'll lose the best business to more nimble competitors. For agencies struggling to build these frameworks, partnering with an expert coach can provide the external accountability needed to turn these metrics into results.
Lagging Results vs. Behavioral Velocity: Benchmarking the Elite Producer
You can't wait three years to see if a producer validates. That's an expensive gamble that most agencies lose. The industry norm for reaching breakeven revenue is notoriously slow, often stretching into the third year of employment. Elite agencies don't accept this mediocrity. They cut this timeline in half. By focusing on behavioral velocity, you identify winners before the first year's commissions are even tallied. If you aren't tracking key performance indicators for insurance producers with a focus on tenure-based benchmarks, you're subsidizing failure.
A producer's "hunt" must be measured by the quality of the kill, not just the frequency. Tracking the retention of new business ensures your producers aren't just bringing in "churn-and-burn" accounts that will vanish at the first renewal. Furthermore, elite producers demonstrate high cross-sell and upsell velocity. They don't just sell a policy; they secure the entire account. If a new hire isn't expanding their footprint within the first twelve months, they aren't an elite producer. They're an order taker.
The First 90 Days: A Critical Performance Timeline
The first three months determine the trajectory of a producer's career. In Month 1, the focus remains entirely on inputs. You must track MicroLearning completion and raw activity volume. If they can't handle the discipline of training, they won't handle the pressure of the field. Month 2 shifts the focus to appointment setting and discovery call mastery. Are they getting in front of the right people? By Month 3, you should see the first binds and the clear validation of your insurance producer development plan. If the pipeline is empty by day 90, the investment is likely a total loss.
Calculating the Real ROI of a Producer
A non-producing hire is a massive drain on agency capital. The true cost includes salary, benefits, and the massive opportunity cost of lost market share. Elite training doesn't merely "help" a producer; it doubles the likelihood of them reaching top-tier status. Using data to justify the investment in outsourced producer development is a survival strategy for the modern agency. Do you want to gamble on "potential," or do you want to invest in a battle-tested framework that guarantees a return?
Validated Producer: Reaches breakeven in 50% of the industry norm time.
Non-Producer: Consumes agency resources for 24 months before failing.
Elite Status: Achieved by producers who master behavioral velocity early.
Implementing an AI-Driven KPI Dashboard for 2026
Stop pretending your CRM is an objective source of truth. Most CRM data is a collection of best guesses and late-night entries by producers trying to avoid a lecture. Manual data entry is the enemy of accurate performance tracking. It's slow. It's subjective. It's often wrong. The cost of bad data is more than just a messy spreadsheet; it's a strategic blind spot that leads to poor hiring and retention decisions. To build an elite agency, you need a dashboard that captures raw, unfiltered behavioral data in real-time. This is where key performance indicators for insurance producers evolve from static numbers into dynamic tools for growth.
AI-driven tools now allow us to measure what was previously invisible. We aren't just tracking if a call happened; we're measuring the quality of the conversation. Did the producer ask high-value discovery questions? Did they handle the objection with poise or retreat? By integrating MicroLearning data directly into your dashboard, you can see the direct correlation between a producer’s training engagement and their closing ratio. This creates a real-time feedback loop that makes the traditional monthly review obsolete. If a producer’s skills are slipping, you know today, not four weeks from now.
The Role of AI in Measuring Sales Skills
Implementing AI sales coaching for insurance changes the game by grading discovery questions with surgical precision. It isn't just about what was said, but how it was received. Sentiment analysis identifies if a prospect actually trusts your producer or if they're just being polite. Automated role-play allows producers to sharpen their skills in a safe environment before they ever risk a live lead. This ensures every key performance indicator for insurance producers you track is backed by verified skill mastery, not just empty activity volume.
Building a Visual Performance Culture
Data should inspire, not intimidate. Visual leaderboards that focus on personal bests rather than just team rankings can transform your agency’s energy. A visual dashboard creates a culture of transparency where excellence is the only standard. When every producer can see the behavioral velocity required to win, the average performers either step up or step out. We use this KPI data to drive our weekly live workshops, focusing training on the specific areas where the data shows a weakness. However, data without interpretation is just noise. This is why elite agencies leverage a Fractional CRO to interpret dashboard trends and provide the high-level strategy needed to act on these insights. If you're ready to stop guessing and start leading with data, explore our effectiveness tools today.
Accelerating Producer ROI with the IICS Sales Academy
Knowing the metrics is a start. Executing on them is where most agencies fail. You can't just hand a producer a dashboard and expect elite results. You need a system that builds the muscle memory of success. This is why we built The Sales Academy for property and casualty Insurance Producers. It's not a generic training program. It's a high-intensity, 3-month curriculum designed to automate the tracking of elite behaviors from day one. We don't just teach; we measure. If your current training doesn't link daily activity to specific key performance indicators for insurance producers, you're just hoping for the best. Hope is not a strategy.
Our academy leverages a combination of 1:1 Call Coaching and AI-driven insights to ensure every interaction is an opportunity for growth. By the time a producer finishes our program, they aren't just selling. They're operating with a level of behavioral velocity that makes success inevitable. This systematic approach is how our graduates achieve breakeven revenue in half the time of the industry norm. If you're tired of slow ramp-up times and inconsistent pipelines, you need a framework that prioritizes the right habits through disciplined, data-backed development.
The IICS Methodology: 40 Years of Battle-Tested Growth
We bring a 40-year track record of growth to every partnership. Our methodology isn't based on theory. It's based on the results of thousands of producers across the country. Graduates of our academy are twice as likely to become top producers because we focus on the synergy of MicroLearning and weekly live workshops. We provide the strategic effectiveness tools necessary to navigate the complex P&C environment with precision. We don't just tell producers what to do; we show them how to win.
Taking the Next Step Toward Elite Performance
Tracking data is useless if you don't have the leadership to act on it. Many agencies lack the internal structure to manage these complex metrics effectively. This is where our Fractional CRO/CGO services can transform your insurance agency sales performance. We provide the high-level guidance needed to turn raw data into a competitive advantage. The cost of waiting is too high. Every day you spend without a data-driven strategy is a lost opportunity for revenue and market share. It's time to stop settling for average performance. Audit your producer development program with IICS today.
Master the Behavioral Velocity of Success
The transition from reactive management to proactive growth starts with a shift in focus. You've seen why relying on lagging results is a recipe for stagnation. By mastering the right key performance indicators for insurance producers, you turn sales from a guessing game into a predictable science. You now have the blueprint to measure prospecting velocity, leverage AI-driven sentiment analysis, and hold your team to an elite standard of performance. Don't let your agency fall behind as the industry evolves.
Stop gambling on talent that might never validate. With a 40-year track record of driving growth, we've developed the ultimate system for producer development. Our methodology uses cutting-edge AI-driven coaching technology to double the industry success rate of your new hires. It's time to build the elite team your agency deserves. Enroll your next hire in the IICS Sales Academy today. The path to the top tier of the P&C industry is paved with data and discipline. Your future starts now.
Frequently Asked Questions
What is the most important KPI for a new insurance producer?
The most critical KPI is the number of weekly new business appointments. While premium is the ultimate goal, appointments are the engine that drives the entire sales process. A new producer who isn't in front of prospects isn't learning or selling. Tracking these key performance indicators for insurance producers ensures that behavioral velocity remains high during the ramp-up phase. If the calendar is empty, the pipeline is dead. Focus on this leading indicator to predict future revenue.
How do I calculate the breakeven point for an insurance producer hire?
Calculate breakeven by totaling the producer's salary, benefits, and agency overhead, then comparing it to the cumulative commission revenue they generate. The industry norm for this is often three years. However, elite agencies aim to hit this milestone in half that time. By monitoring behavioral velocity early, you can identify if a hire is on track to cover their cost or if they're becoming a permanent drain on agency capital. Stop subsidizing failure.
How many prospecting calls should a P&C producer make per week?
An elite P&C producer should aim for 50 to 100 high-quality prospecting outreaches per week. Raw volume matters, but the frequency of meaningful connections is the real metric. If a producer is making fewer than 10 outreaches a day, they aren't hunting; they're waiting. This activity level is the baseline for building a sustainable pipeline. Are your producers hitting these numbers, or are they hiding behind administrative service work and excuses?
What is a good quote-to-bind ratio for commercial insurance?
A healthy quote-to-bind ratio for commercial lines typically ranges between 25% and 35%. If the ratio is lower, the producer is likely quoting anything that breathes instead of qualifying prospects effectively. If it's significantly higher, they might not be prospecting enough new business. This metric reveals the efficiency of your sales process. Use it to identify whether the breakdown is in prospect qualification or the final closing presentation. Data doesn't lie.
Can AI really help track producer performance without being intrusive?
AI tracks performance by objectively analyzing call quality and sentiment without requiring manual data entry. It isn't about surveillance; it's about skill development. AI tools can grade discovery questions and prospect engagement automatically. This provides producers with immediate, data-backed feedback that a human manager couldn't possibly deliver in real-time. It replaces the gut feeling of a manager with the surgical precision of data-driven coaching. It's the modern way to track key performance indicators for insurance producers.
How often should I review KPIs with my sales team?
Review leading activity KPIs weekly to maintain momentum and address skill gaps immediately. Waiting for a monthly review is too slow in a competitive market. Monthly reviews should focus on lagging indicators like revenue and pipeline health. This rhythm ensures that performance remains top-of-mind. Constant visibility creates a culture of accountability where every team member knows exactly where they stand against their goals. If you don't measure it, you can't manage it.
What is the difference between a sales metric and a KPI?
A sales metric is any data point you track, such as total calls or emails sent. A KPI is a key indicator that directly impacts your strategic outcomes. While you might track dozens of metrics, you should only focus on three to five KPIs that define success. KPIs are the levers you pull to change the direction of the business. Are you drowning in useless data, or are you focused on the metrics that actually move the needle?
How do I handle a producer who consistently misses their activity KPIs?
First, determine if the failure is a will issue or a skill issue. If they have the skill but lack the drive, it's a discipline problem that requires a firm timeline for improvement. If they have the drive but lack the skill, they need targeted coaching or MicroLearning. However, if activity doesn't improve within 30 days, you must be prepared to part ways. Keeping a non-producer is an investment in failure you can't afford.